I have got my datacamp premium subscription with GitHub Student Developer pack for three month. Aiming at completing a course in a day. I believe that would be 3-4hrs time commitment everyday with all the academics but I’ll manage.
I’ll update this blog everyday just to show what I am learning.
Day1: Intermediate Python
I am learning visualisation in python with matplotlib library.
Sample of work:
>>> from django.utils.html import strip_tags
>>>
>>> strip_tags('<p>this is a title</p>')
'this is a title'
>>>
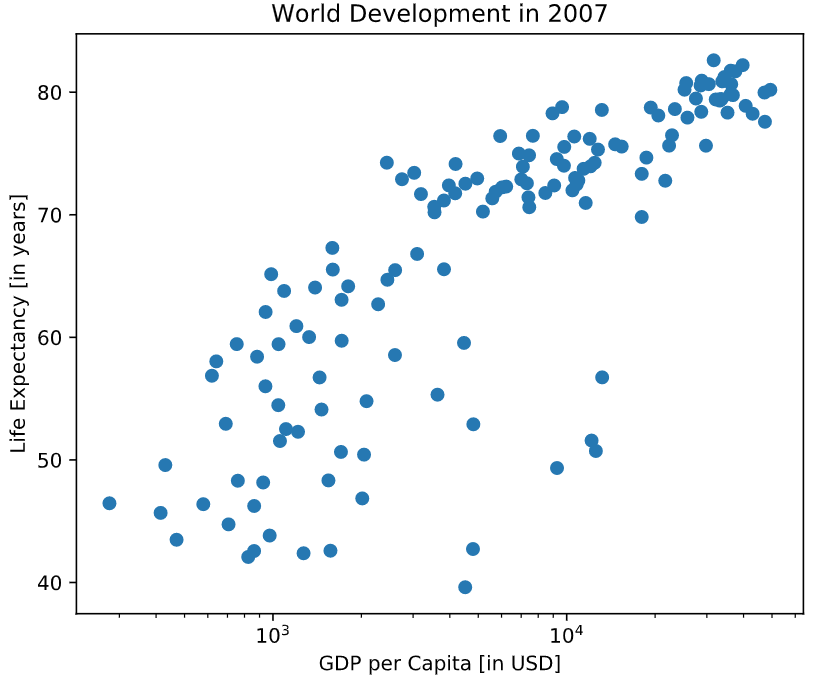
# Basic scatter plot, log scale
plt.scatter(gdp_cap, life_exp)
plt.xscale('log')
# Strings
xlab = 'GDP per Capita [in USD]'
ylab = 'Life Expectancy [in years]'
title = 'World Development in 2007'
# Add axis labels
plt.xlabel(xlab)
plt.ylabel(ylab)
# Add title
plt.title(title)
# After customizing, display the plot
plt.show()